Zygo's NewView™ 8000 Series NewView™profilers usingCoherence Scanning Interferometry (CSI) and Mx™ software with patented Frequency Domain Analysis (FDA) allow direct quantification of surface texture measured to fractions of nanometers. With proper treatment of measurement parameters such as the effect of vibration, instrument calibration and appropriate choice of measurement parameters, measurement accuracies of tens of picometers (10-11 m) can be achieved. High measurement accuracy is required, for example, for diamond machined optical surfaces (single-point diamond turning optics).
The measurement of surface texture with Zygo profilometers is based on the phenomenon of white light interference(white light interferometry). It allows to achieve up to sub-angstrom repeatability. These capabilities are being developed to enable the measurement of super-smooth surfaces produced by increasingly high quality machining processes, for example in engineering, aerospace and the aforementioned optics.
Understanding system noise
The first step in making quantitative measurements of super-smooth surfaces is to realize that every measurement system is also a source of inherent noise. This noise is the result of many factors including electronic noise, sensory noise, small irregularities in the reference surface, and vibrations caused by changes in the measurement environment. For most samples, noise is negligible when measured with NewView 8000 Series profilers due to the high signal-to-noise ratio resulting from the unique data acquisition method and subsequent evaluation algorithms. However, for very smooth surfaces this generally cannot be claimed. For such samples, it is necessary to understand the sources of noise and then reduce their influence to the lowest possible level.
Some sources of noise can be eliminated or at least strongly reduced by controlling the external measurement conditions (e.g. acoustics, airflow, temperature fluctuations) and by, for example, a sufficient number of measurement repetitions to average the values.
Control of the environment during the measurement
The first task in setting up the measurement of super-smooth surfaces is to establish control over the environment during the measurement. The ideal measurement environment is as follows:
- Mechanically and acoustically quiet to minimize the effects of vibration.
- Temperature stabilized to minimize sample and lens changes during measurement
- With well-controlled airflow to prevent airflow between the sample and the objective during measurement.
Control of vibration, noise and temperature stability are paramount. At short working distances of the objective, airflow has less impact on the overall noise. However, for lenses with long working distances, the latter point also needs to be taken into account.
Determination of system noise
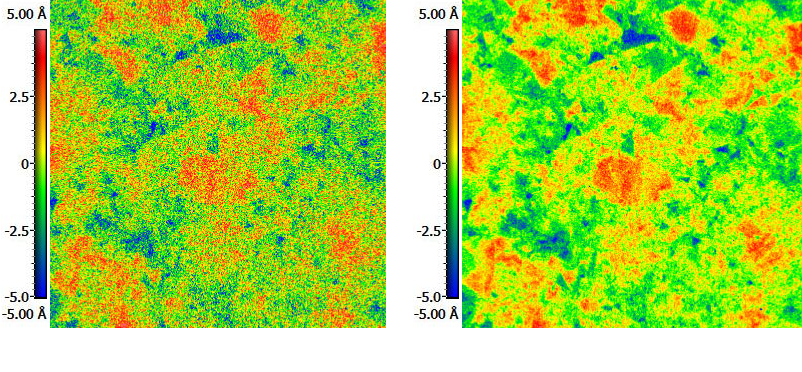
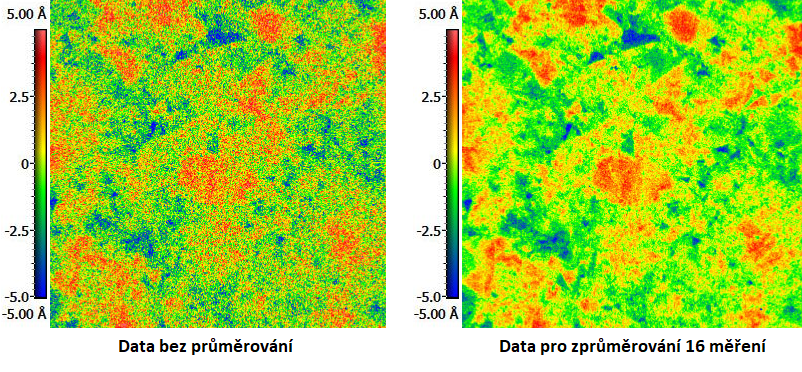
The noise of a measurement system can be defined as theroot mean square ( RMS) of two consecutive measurements of the same sample area. Typically, however, the RMS value of several (10 or more) consecutive measurements of the same area is reported. This value is referred to as the Surface Topography Repeatability( STR). The STR value decreases if each measurement consists of averaging multiple values. STR can also be thought of as the ratio of the noise bandwidth A (Noise bandwidth) and the square root of the acquisition time √t. The noise bandwidth A of a system is a coefficient that allows the measurement performance of a given system configuration to be evaluated independently of the acquisition time and the amount of averaged data per measurement. Thus, for a given system, the A-factor can be estimated using the STR (data sheet) value and the required measurement time.
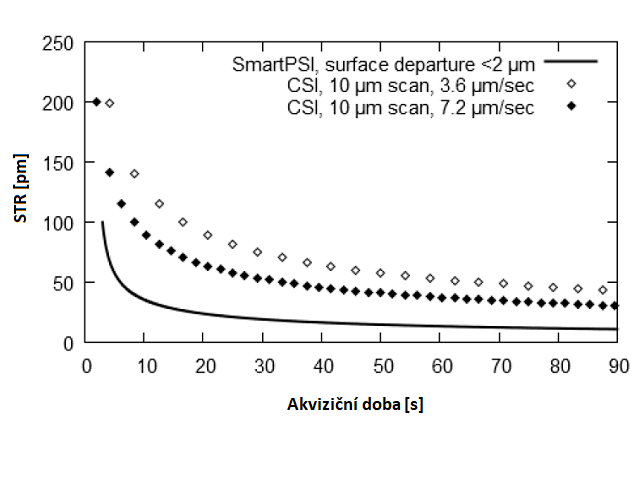
For example, the NewView 8300 has a stated STR=0.2 nm with an acquisition time of 2 s for a 10 µm scan. This corresponds to a noise bandwidth value of A = STR-√t= 0.28 nm-√s. The STR value can then be reduced by increasing the acquisition time while maintaining the measurement conditions (see graph on the right). The accompanying graph also shows that the noise bandwidth is much lower for SmartPSI measurements (a proprietary method developed by Zygo) than for standard CSI measurements, resulting in better STR values for a given data collection time.
How low a noise level do I need for a given application?
While there is no universal guide for determining the value of measurement time for all surface types. However, for example, when measuring rough surfaces measured on the order of tens of nanometers or more, we recommend setting the data acquisition time such that the STR value is at least an order of magnitude lower than the surface roughness value. For super-smooth surfaces on the order of units to tens of Å, such a requirement would result in extremely long data acquisition times even when using the SmartPSI method. For such surfaces, we therefore recommend a threshold STR value two to four times lower than the measured surface roughness.
Conclusion
Using the methods and procedures described above, Zygo was able to demonstrate the ability to measure surfaces finer than 0.05 nm. Through a combination of careful control over the measurement conditions described above, appropriate selection of the number of averaging steps for each measurement (depending on the value of the noise bandwidth), and selection of the appropriate internal precision, the highest quality surface texture measurements with the optical profilometer were achieved.