In semiconductor manufacturing, rapid and reliable wafer quality screening is critical to protecting yield and accelerating production. Traditional inspection methods, such as optical microscopy or electrical testing, provide limited insight into subsurface structures and material heterogeneities, which can lead to device performance variability or downstream failures.
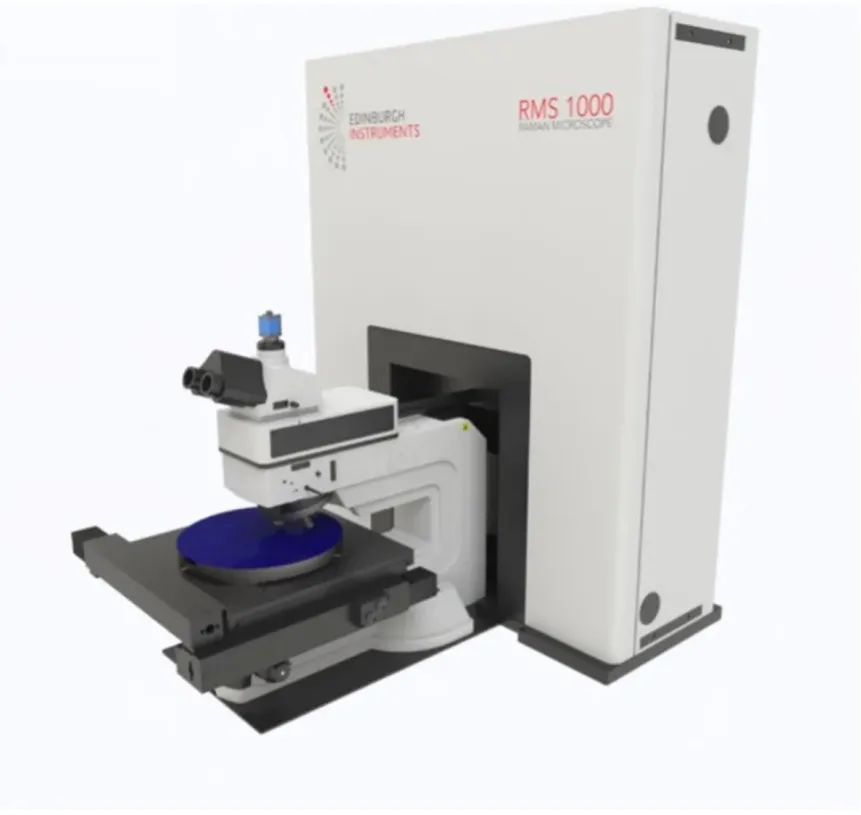
Confocal Raman microscopy offers a non-destructive and highly sensitive approach to probe material properties across an entire wafer. The RMS1000 Confocal Multimodal Microscope, equipped with WaferMAP® and integrated with the RamanQA Python module, turns this capability into a fully automated quality assurance workflow. RamanQA extracts key spectral parameters, applies tolerance thresholds, and uses multivariate analysis to generate objective pass/fail decisions.
This Application Note demonstrates how RamanQA can rapidly assess semiconductor wafer quality, automatically produce pass/fail maps, and provide actionable insights for engineers and researchers. By combining high-throughput data acquisition with robust statistical analysis, RamanQA enables faster and more confident wafer screening, streamlining both routine quality control and detailed defect diagnostics.
Key points
- Save time and increase confidence in wafer quality analysis with automated full-wafer Raman screening on the RMS1000 with WaferMAP.
- RamanQA, in the Ramacle Python IDE, ensures high sensitivity and robust quality assurance of wafers by combining peak parameter and multivariate pass/fail thresholding of the spectral dataset.
- Results are automatically compiled into comprehensive, audit-ready reports with maps, histograms, and tables, enabling engineers to quickly locate problem areas and make informed quality decisions.
RamanQA step-by-step methodology
The RamanQA method applies automated spectral-feature extraction and statistical tolerance analysis across large wafer datasets. The workflow is summarised below:
1. Data acquisition in WaferMAP
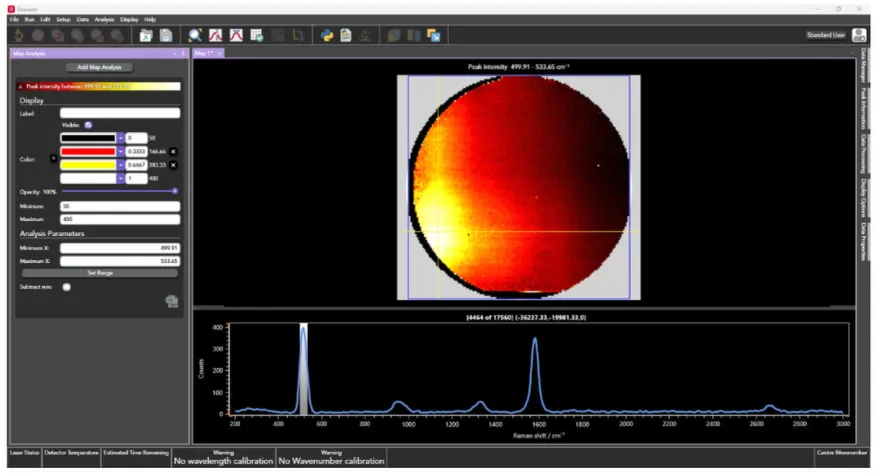
In WaferMAP, Raman spectra are collected across a wafer. The resulting image dataset contains hundreds to thousands of spectra, each representing the state of a small region on the wafer surface and containing information about localised strain, defects, material heterogeneities, or surface impurities.
2. Raman peak feature extraction
For each spectrum, the primary wafer Raman mode (e.g. 520 cm⁻¹ for Si, 567 cm⁻¹ for GaN, 1581 cm⁻¹ for graphene) is detected, and the peak intensity, position, and full width at half maximum (FWHM) are extracted (Table 1). These values form the core physical wafer-quality metrics.
| Peak parameter | Likely cause of variance in parameter |
|---|---|
| Peak intensity | Crystallinity, doping, surface contaminants |
| Peak position (cm⁻¹) | Strain, doping, crystallinity |
| FWHM (cm⁻¹) | Disorder, defects, strain |
Across all acquisition points, median values for each extracted spectral parameter are calculated. These medians define the wafer’s expected “normal” Raman response. It is also possible to define the wafer’s expected response based on historical data if the same wafer type is analysed repeatedly over time.
3. Multivariate spectral consistency analysis
RamanQA includes the option for multivariate analysis to detect subtle spectral deviations that are not captured by semiconductor peak metrics alone, for example, from a non-fluorescent contaminant with spectral features that do not overlap with the semiconductor band or bands under investigation. The two available analysis tools are Pearson correlation and Mahalanobis distance (MD). The inclusion of both ensures sensitivity and robustness for both quantitative and qualitative spectral deviations. A detailed technical discussion of these methods is provided in the appendix for interested readers.
4. Tolerance window selection
User-defined tolerance thresholds (e.g. ±2 cm⁻¹ for position, ±20% for peak intensity and FWHM) are applied. Each spectrum is then classified based on whether all parameters lie within these acceptance windows. Tolerances for Pearson correlation and MD are also set.
For Pearson correlation, an r value of 0.95 is considered an excellent match to the median wafer spectrum, and any spectra with an r value less than 0.9 relative to the median are likely to indicate a defect or contaminant. For MD, a practical threshold is 3. This acts as a strong statistical filter: a value above 3 indicates greater than 99% confidence that the wafer behaviour at that point is abnormal.
5. Pass-rate determination
A wafer pass rate is calculated as the percentage of spectra that meet all selected criteria (tolerance thresholds and optional multivariate tests).
6. Final classification
If the pass rate exceeds the user-defined acceptance level (fully customisable), the wafer is classified as Pass; otherwise, it is classified as Fail. This framework supports both high-throughput routine screening and detailed defect diagnostics.
7. Mapping of pass/fail regions and visualisation
Wafer-scale visual outputs are automatically generated in RamanQA, including:
- An overall pass/fail map, which shows which pixels meet all tolerance criteria.
- Peak feature maps, which illustrate spatial variations in peak position, intensity, and FWHM.
- A Pearson correlation map, which identifies spectra with low correlation to the wafer-average spectrum.
- A PCA MD map, which highlights statistical outliers in multivariate spectral space.
In addition, histograms and box plots of each metric are produced to summarise wafer-wide distributions, enabling quantitative insight into variability, deviations, and outlier behaviour.
All outputs are compiled into a PDF report that integrates wafer maps, plots, and tabulated metrics, providing a complete, actionable overview of wafer quality.
Demonstration of RamanQA on a real wafer
To demonstrate the RamanQA workflow, a full-wafer Raman dataset was acquired from a 4-inch carbon nanotube/silicon wafer using WaferMAP on the RMS1000, deliberately chosen because of the high degree of variability across it. A total of 17,560 spectra were collected across the wafer surface with a step size of 650 µm.
In the RamanQA Python IDE module, all spectra were extracted, the 520 cm⁻¹ band was fitted, and peak intensities, positions, and FWHMs of the band at every pixel were calculated. For the purposes of this Application Note, the following tolerance windows were set for the peak parameters and the multivariate Pearson correlation and MD functions:
- Intensity: +/-50% from median
- Position: +/-2 cm⁻¹ from median
- FWHM: +/-20% from median
- Pearson minimum r: 0.9 against median
- Maximum MD: 3
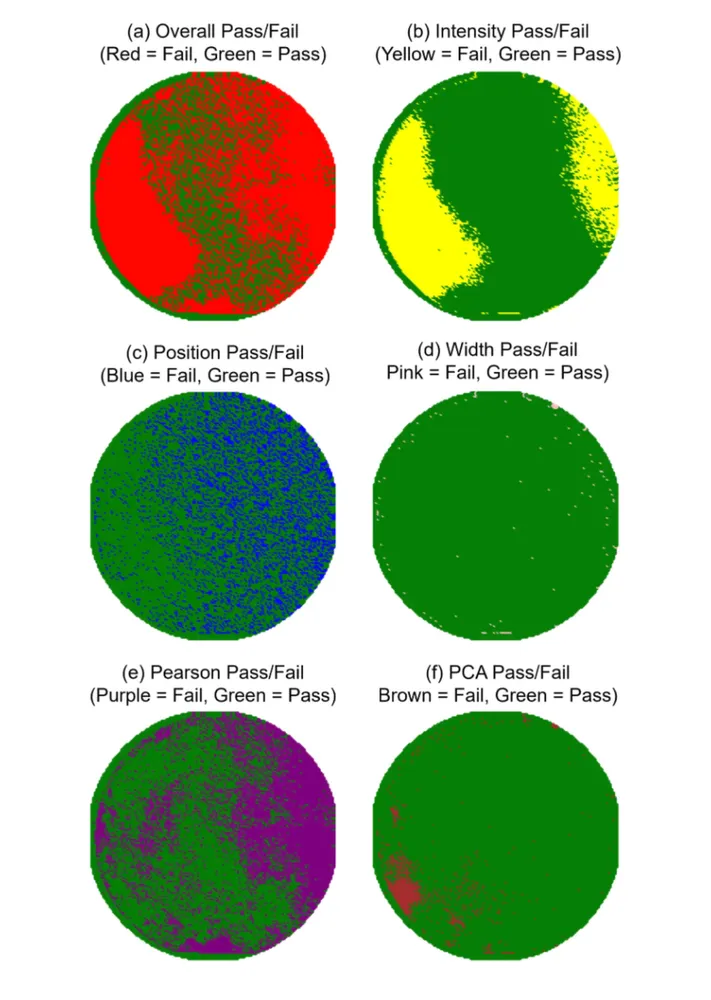
The pass threshold was set at 90% of all spectra, meaning that to Pass, 90% of spectra had to fall within all set tolerance windows. If any spectrum had a single parameter outside its tolerance window, it was set to Fail. The results are shown in Table 2. The overall result was a Fail based on the 90% threshold.
| Metric | Tolerance | % Passed |
|---|---|---|
| Silicon peak intensity | +/-50% from median | 68.85 |
| Silicon peak position | +/-2 cm⁻¹ from median | 73.64 |
| Silicon peak FWHM | +/-20% from median | 99.41 |
| Pearson correlation r | >0.9 against median | 55.77 |
| MD | <3 | 94.92 |
Wafer result: FAIL (peak intensity, peak position, Pearson correlation)
The most likely physical cause of the widespread variation in both the silicon peak intensity and the overall spectral profile (particularly the low Pearson correlation with the median) is inconsistent carbon nanotube (CNT) coverage across the wafer surface.