Two-dimensional excitation-emission spectra are becoming an increasingly desirable output in the study of photoluminescent materials. Using a fast CCD detector, a complete excitation-emission map can be obtained in a very short time.
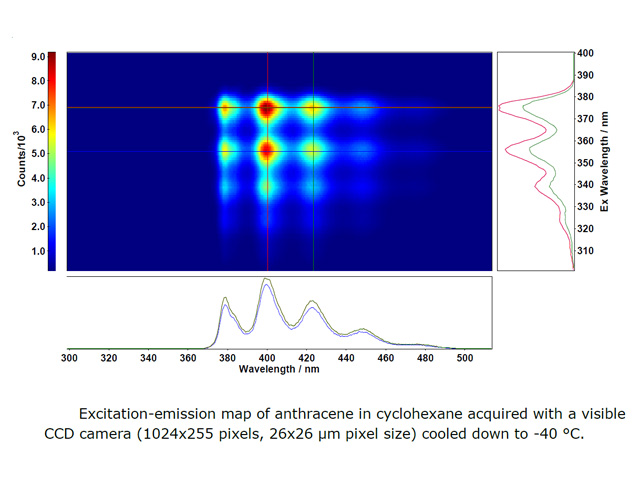
To obtain a complete excitation-emission map (EEM = Excitation-Emission Map), the excitation wavelength must be systematically varied and the emission spectrum recorded for each individual setting. This can be achieved using two monochromators and a single-channel detector(photomultiplier). The excitation monochromator first selects an excitation wavelength for which the emission monochromator coupled to the photomultiplier scans the corresponding emission spectrum. Then another excitation wavelength is set and the emission spectrum is measured again. The whole process is repeated in this way. While this approach is accurate and highly sensitive, it is not capable of projecting results quickly. The time to acquire a complete excitation-emission map can be significantly reduced by using a CCD detector where all emission wavelengths are detected simultaneously on the camera chip.
Excitation-emission spectra measurement set-up
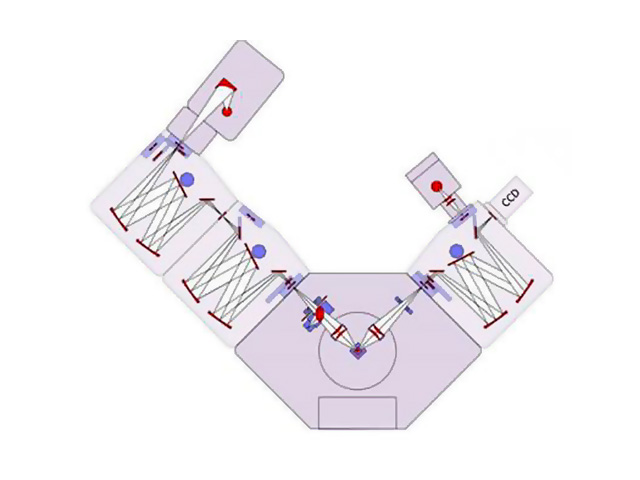
The FLS1000 fluorescence spectrometer configured with a broadband light source, a dual excitation monochromator and a single emission monochromator with a CCD camera and photomultiplier tube. The emission monochromator together with the CCD detector forms a spectrograph.
Source of the report:
AN_P36 v.2; Jul. 16, Maria Tesa, Georgios Arnaoutakis, Edinburgh Instruments, Excitation-Emission spectroscopy with charge coupled detectorswww.edinst.com/wp-content